The case study "Pawson Foundation: August 2006" describes the challenging situation of a top-tier venture capital company. More specifically, a vice-president of a foundation who invested with this venture capital enterprise must decide whether to reinvest in the company's newest fund.
G. Felda Hardymon; Josh Lerner; Ann Leamon
Harvard Business Review (806042-PDF-ENG)
August 31, 2005
Case questions answered:
Case study questions answered in the first solution:
- Introduction
- Compensation
- Performance measurement
- How much do they propose to keep?
- Should the Pawson Foundation invest?
- Conclusion
Case study questions answered in the second solution:
- How much money is Mayfield proposing to keep?
- Should Pawson invest?
Not the questions you were looking for? Submit your own questions & get answers.
Pawson Foundation: August 2006 Case Answers
This case solution includes an Excel file with calculations.
You will receive access to two case study solutions! The second is not yet visible in the preview.
Introduction – Pawson Foundation
Martin Smith, Vice President of the Pawson Foundation, is faced with the challenge of deciding whether to reinvest in Mayfield.
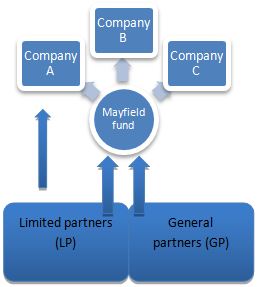
In the US, most (if not all) Private Equity funds are organized as partnerships. Mayfield, one of the most successful venture capital firms in the United States, is raising money for its next fund. Their investment strategy is mainly focused on information technology startups and investing opportunistically in the healthcare industry.
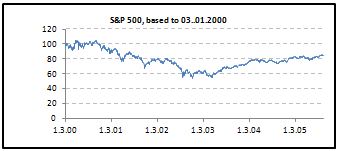
The return from funds raised in 1999-2000 suffered from the dot-com bubble is shown in the graph below. This has evoked a so-called claw-back situation, which means that Mayfield overcharged carry costs in the early stages of the fund and is now in a position where they owe the Limited Partners money. This, combined with the recent poor performance, made Martin Smith uncertain whether to invest or not.

Limited Partners (LP) are usually institutional foundations (Pawson) or high-net-worth investors interested in receiving the income and capital gains associated with investing in a private equity fund like Mayfield.
An important feature is that LPs do not take part in the fund’s active management. Hence, they are protected from losses beyond their initial investment (i.e., committed capital) as well as any legal actions taken against the fund.
General partners (GP) are responsible for managing the investments within Mayfield. For their services, they charge a management fee to cover their expenses and a percentage of the fund’s profits, called carried interest.
An important feature is that the GPs can be legally liable for the actions of Mayfield.

Compensation
The carry often ranges from 5-30% of the total profits. A high carry compensates the VC for success. This is usually constant across funds, and very few funds ask for more than 25% (Mayfield charges 30%). The management fee is typically 2.5% of commitments paid annually and is used to cover the cost of managing the fund.
Note that the fees often change after the investment period (generally 4-6 years on a 10-year fund) as the cost of running the fund decreases.
Usually, PE funds have clauses in their compensation agreements. Two of the main types of clauses are the preferred return provision and, as in this case with Mayfield, claw-back provisions.
The claw-back gives the LPs the right to reclaim a proportion of the GPs carried interest in the event of losses in later investments. In addition, we have compensation terms like Hurdle-rates (often 8%) and catch-up clauses.
Performance measurement is one of the most important issues in Private Equity because of the few acknowledged reporting standards.
On average, the industry yields similar returns to the S&P 500 with a daily and annual average of approximately 0.02% and 6.57%, respectively, as shown in Exhibit 1.
The track record of a fund is the fundamental building block to estimate how it will perform in the future. As we can see in Exhibit 2, Mayfield has historically delivered higher returns for both the industry average and the S&P 500.
However, this is a historical measure, and we never know for sure if history will repeat itself. In addition, macroeconomic conditions vary, so we must compare funds from the same vintage years.
There are several ways to interpret the return of a fund.
Firstly, we should decide whether or not to look at the gross or net return. Should we look at the return Mayfield managed to retrieve on called capital and ignore fees and carry? Or should we look at the return actually returned to the LP?
Secondly, we would want to know which measurement to use and the limitations of those measurements.
We believe that we should only look at the net return because this is what the LPs care about. This is what the LPs would get in return after the fees and carry, and is what they are left with. Another argument is that net return makes it possible to compare the return to a benchmark, which would not be possible with gross return due to the different fees and carries that the funds use.
The most common performance measurement within the PE industry is IRRs and multiples. Both of them have their strengths and weaknesses and complement each other. The IRR ignores the numerical size aspect but not the timeline of the investment, whereas the multiple gives you a numerical size of the investment and ignores the time aspect.
Neither of them takes risk into consideration but is still frequently used as a performance tools due to its simplicity. One could argue that NPV would be the best measurement, but there is usually not enough data to do the risk adjustment. We conclude that we will use a combination of both IRRs and multiples to calculate the return of Mayfield’s.
The return and performance from fund Mayfield I – Mayfield IX is given in the case. The net IRR of the funds varies from 4.5 % – 49 %, yielding an average IRR of 26.3 %.
We also notice that Mayfield has outperformed the benchmark IRR for all funds except Mayfield V, which yielded an IRR of 4.5 %. All in all, Mayfield seems to have performed well, at least compared to benchmarks and in terms of IRR.
The figures for “Multiple” listed in the case give us the total (both realized and unrealized) net return based on the fund’s size. The multiple ranges from 1.3x to 6,52x with an average of 3.4x, meaning that an investor in Mayfield, on average, gets $3.4 back per dollar invested.
We calculated the IRR for funds IX, X, and XI to be 40.4%, -15.6%, and -1%, further described in Exhibit 3. We made a different assumption in order to…
Unlock Case Solution Now!
Get instant access to this case solution with a simple, one-time payment ($24.90).
After purchase:
- You'll be redirected to the full case solution.
- You will receive an access link to the solution via email.
Best decision to get my homework done faster!
Michael
MBA student, Boston
 Best decision to get my homework done faster!